Method
Disgustingly Accurate
o
****
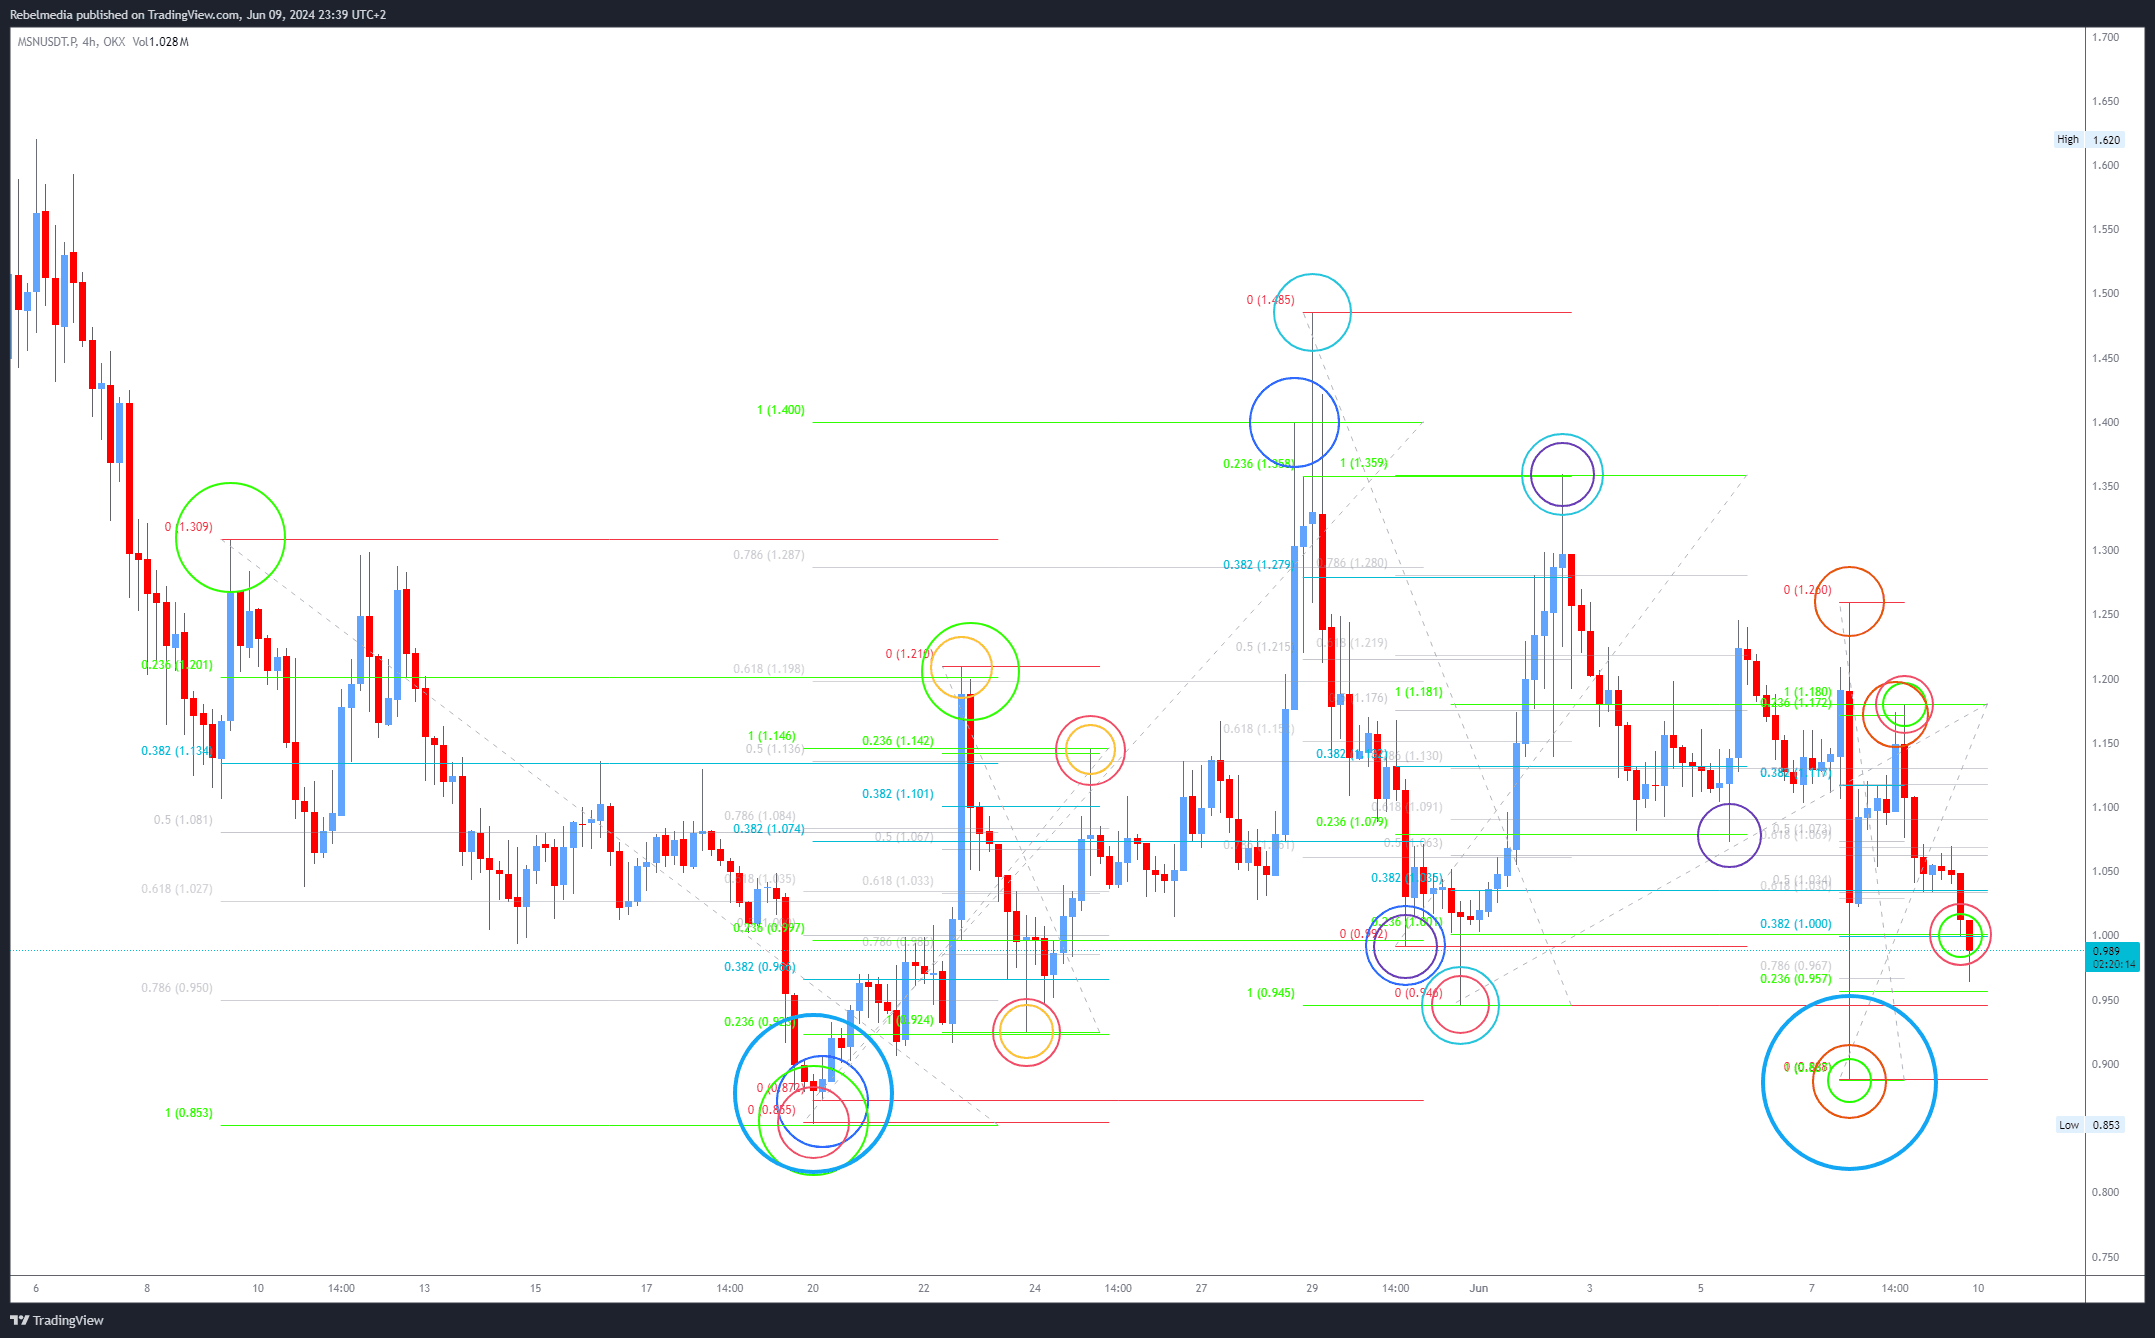
Below is an image sequence that illustrates how interlocking fractals fit together to create the everyday chart patterns we see on every crypto asset and pair, in every timescale, each perfectly proportioned and seemingly pre-planned, since this is the only possible explanation for how these fractals appear to have a price memory that has no known time limitation and applies to crypto, stocks, forex and every other traded asset class.
****
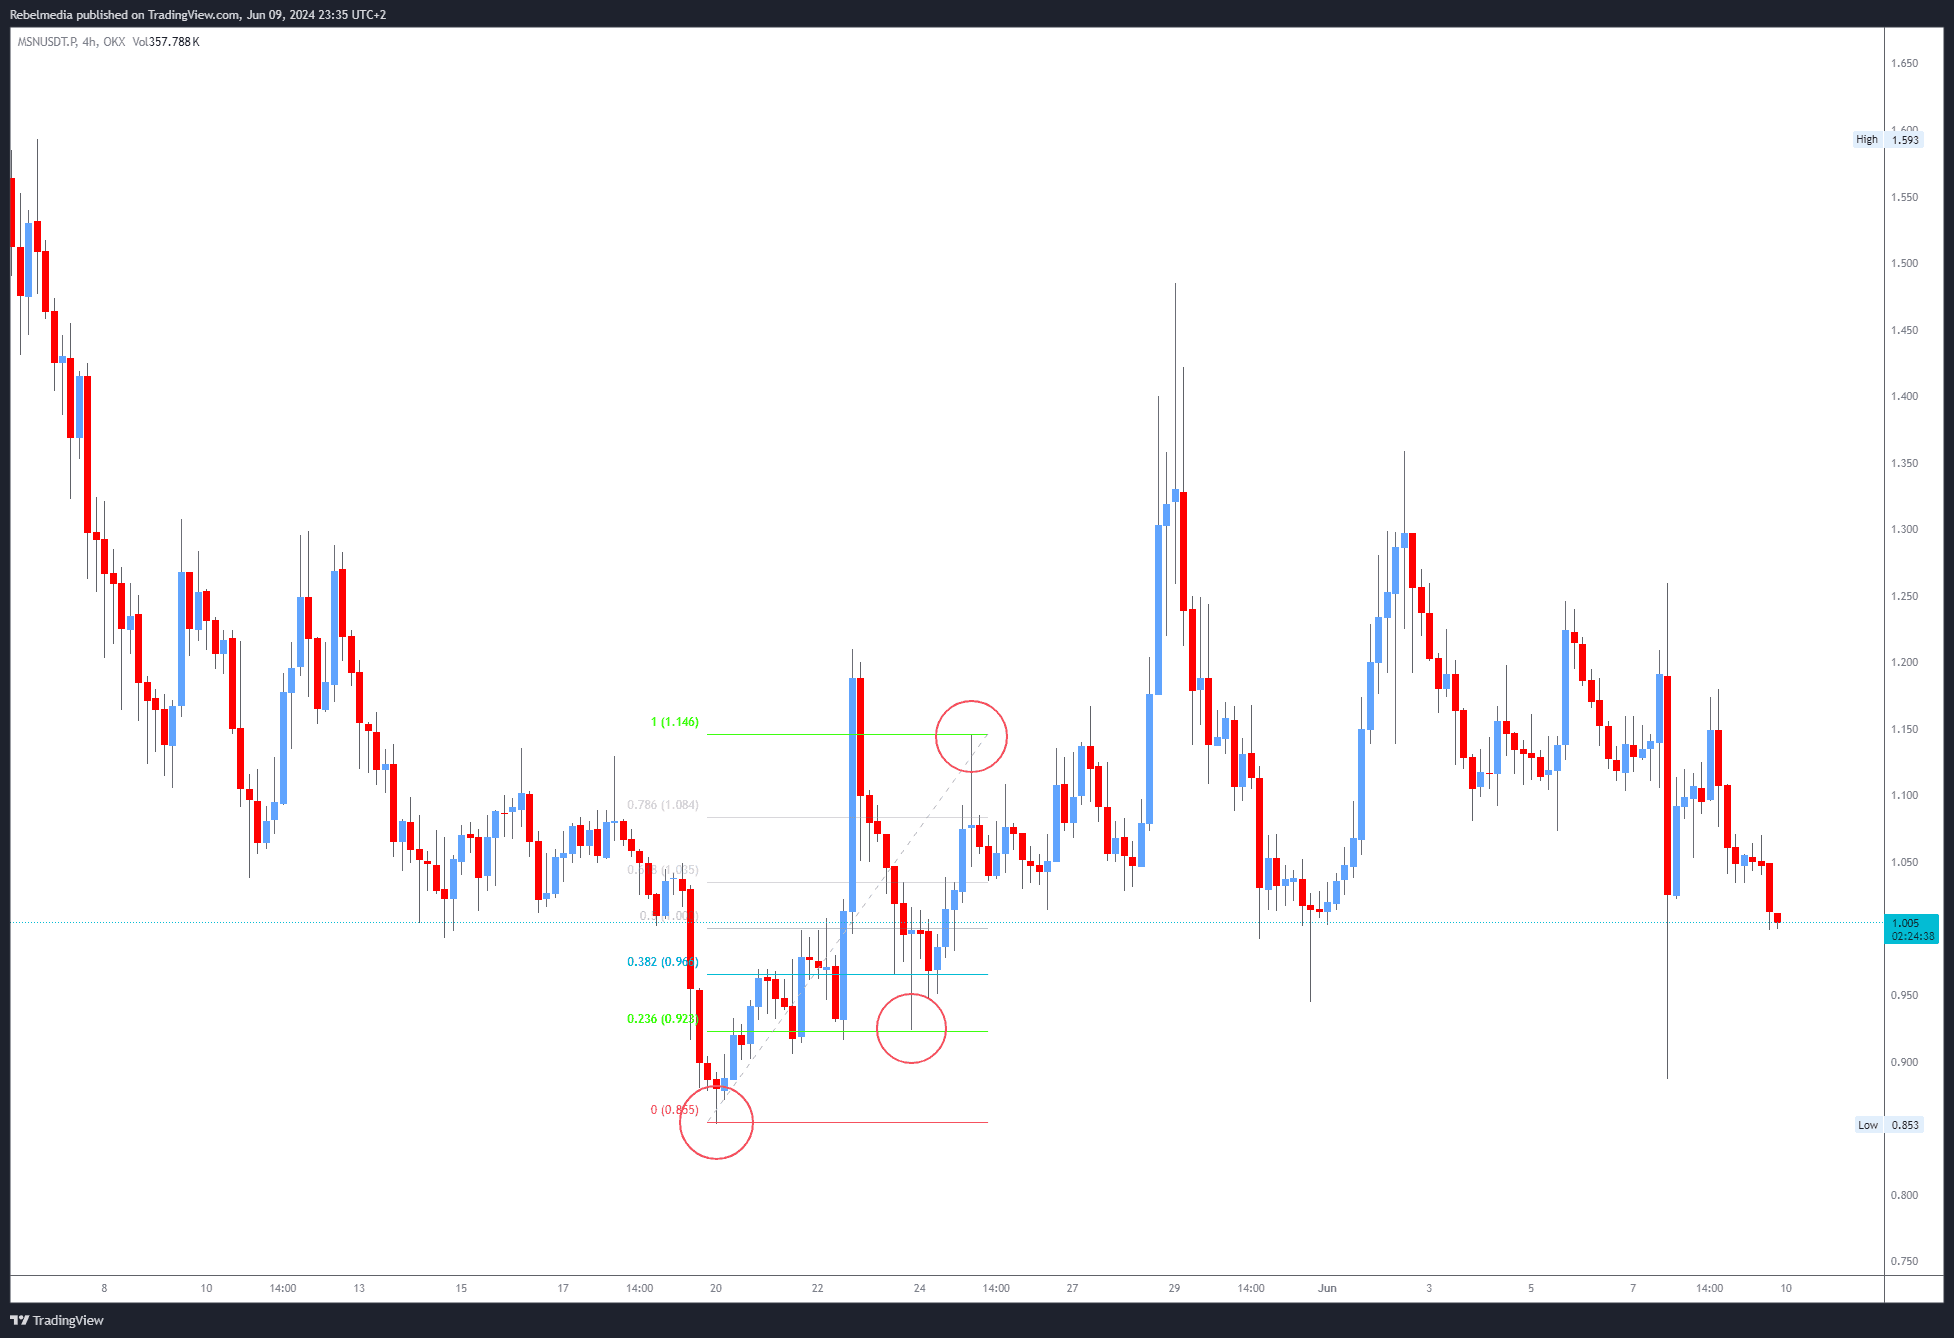
Each fractal has a different colored set of 3 circles positioned at the same exact Fibonacci levels: 0, 1, 0.236.
The pattern repeats in both directions. Bearish fib patterns form a V shape and the bullish counterpart is simply inverted to resemble the letter A.
The chart segment below has 9 clearly identified interlocking cycles.
Below is an image sequence that illustrates how interlocking fractals fit together to create the everyday chart patterns we see on every crypto asset and pair, in every timescale, each perfectly proportioned and seemingly pre-planned, since this is the only possible explanation for how these fractals appear to have a price memory that has no known time limitation and applies to crypto, stocks, forex and every other traded asset class.
****
Each fractal has a different colored set of 3 circles positioned at the same exact Fibonacci levels: 0, 1, 0.236.
The pattern repeats in both directions. Bearish fib patterns form a V shape and the bullish counterpart is simply inverted to resemble the letter A.
The chart segment below has 9 clearly identified interlocking cycles.
1
2
3
1
0.786
0.618
0.50
0.382
0.236
0
At the core of all chart patterns, lies this basic component part.
I call it Method.
The bullish setup starts at the most recent lowest low to the most recent highest high, before retracing to 0.236. Over, and over, and over, infinitely.
It does not deviate and cannot break the simple rules and responsibilities it has that enable it to complete each cycle, in either direction, on every timescale in overlapping and increasingly complex structures that account for ALL price patterns and without even trying, blows a hole in the most sacred of myths held by conventional market theory: That human actions are responsible for price movement.
It is not.
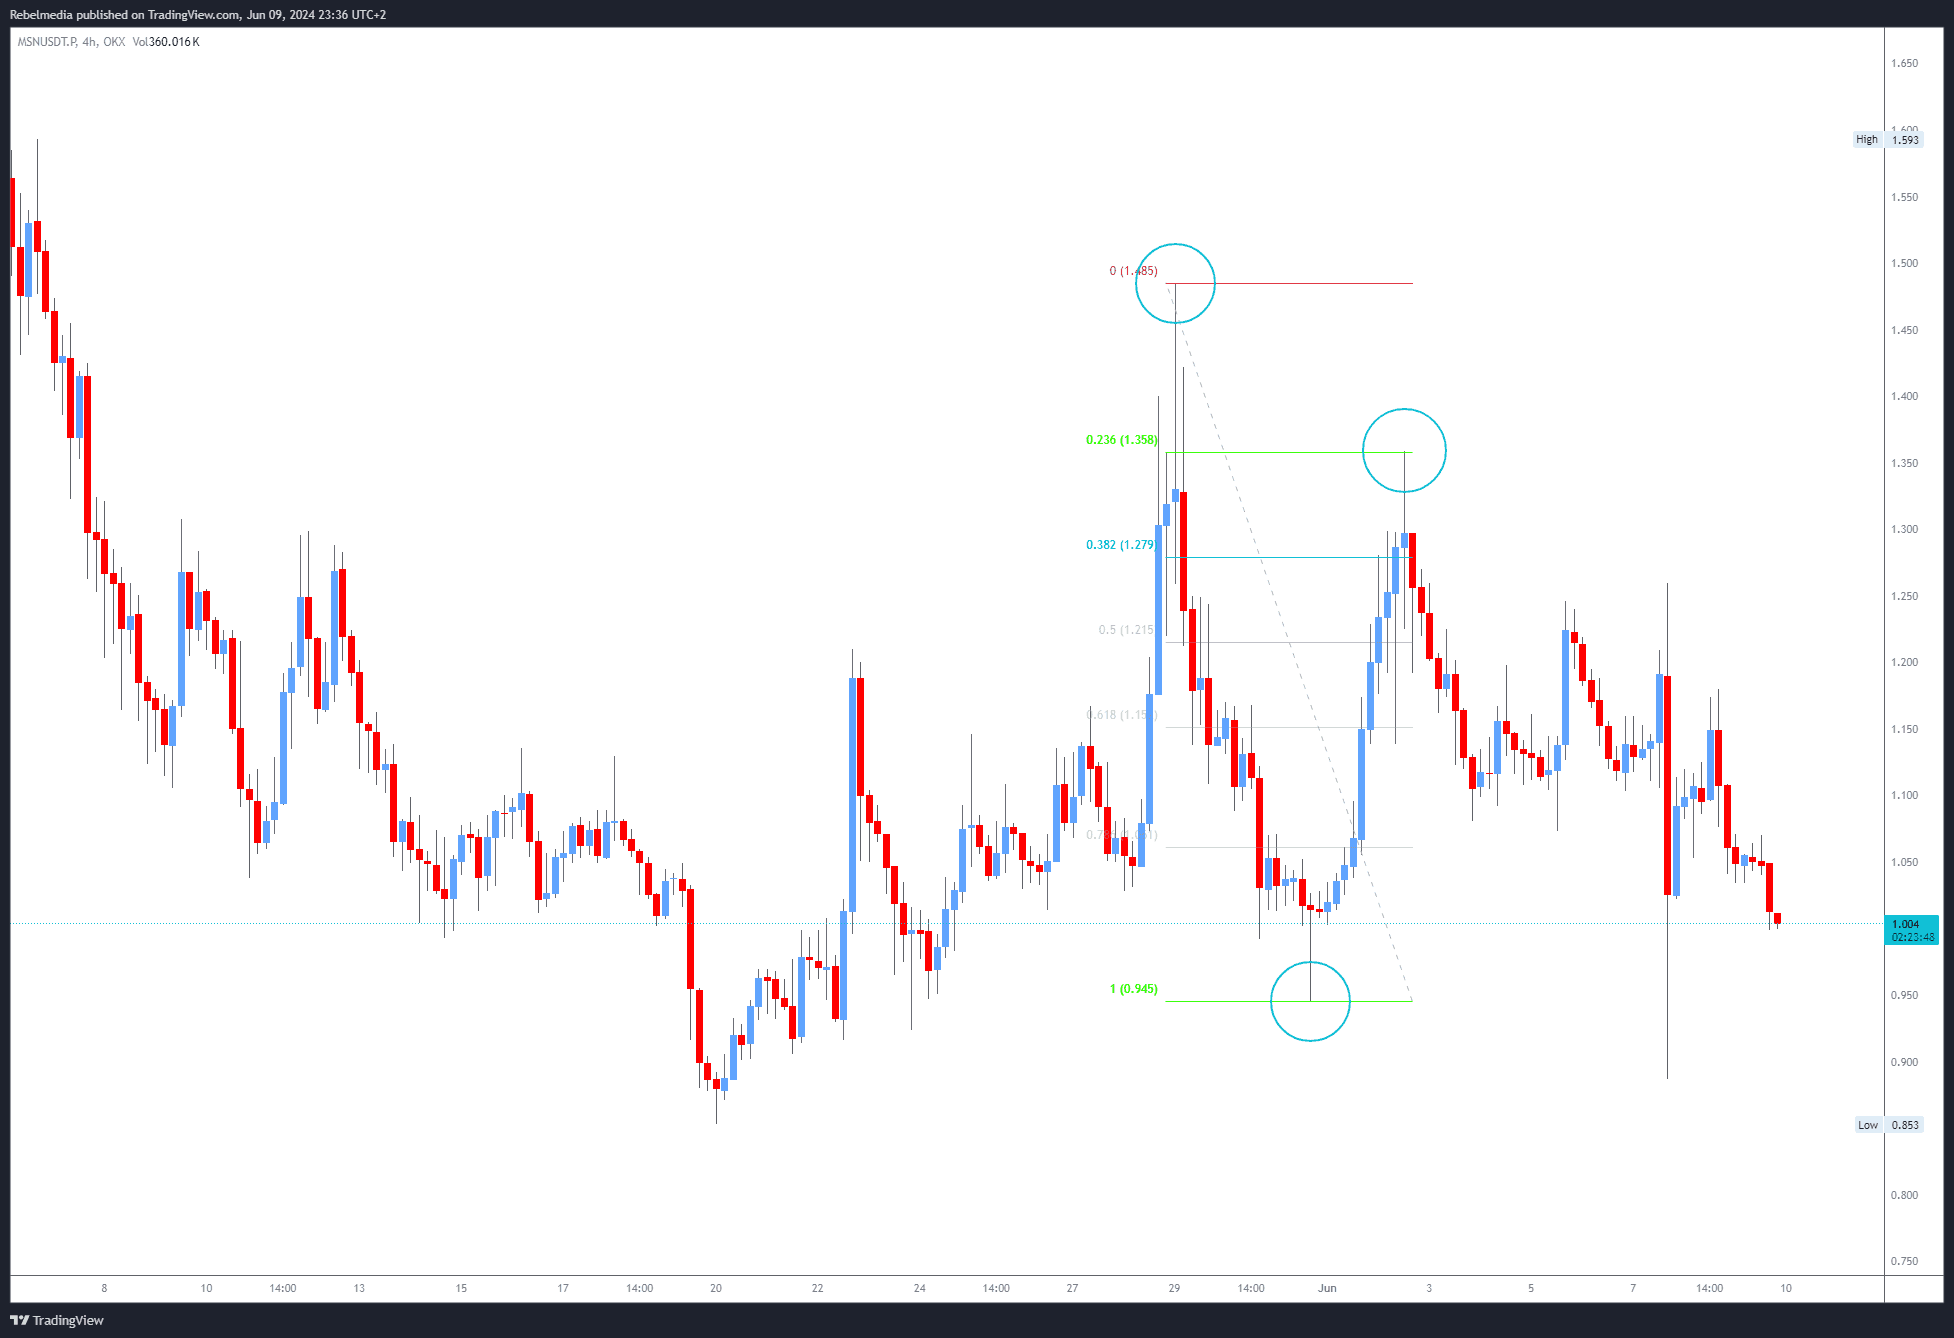
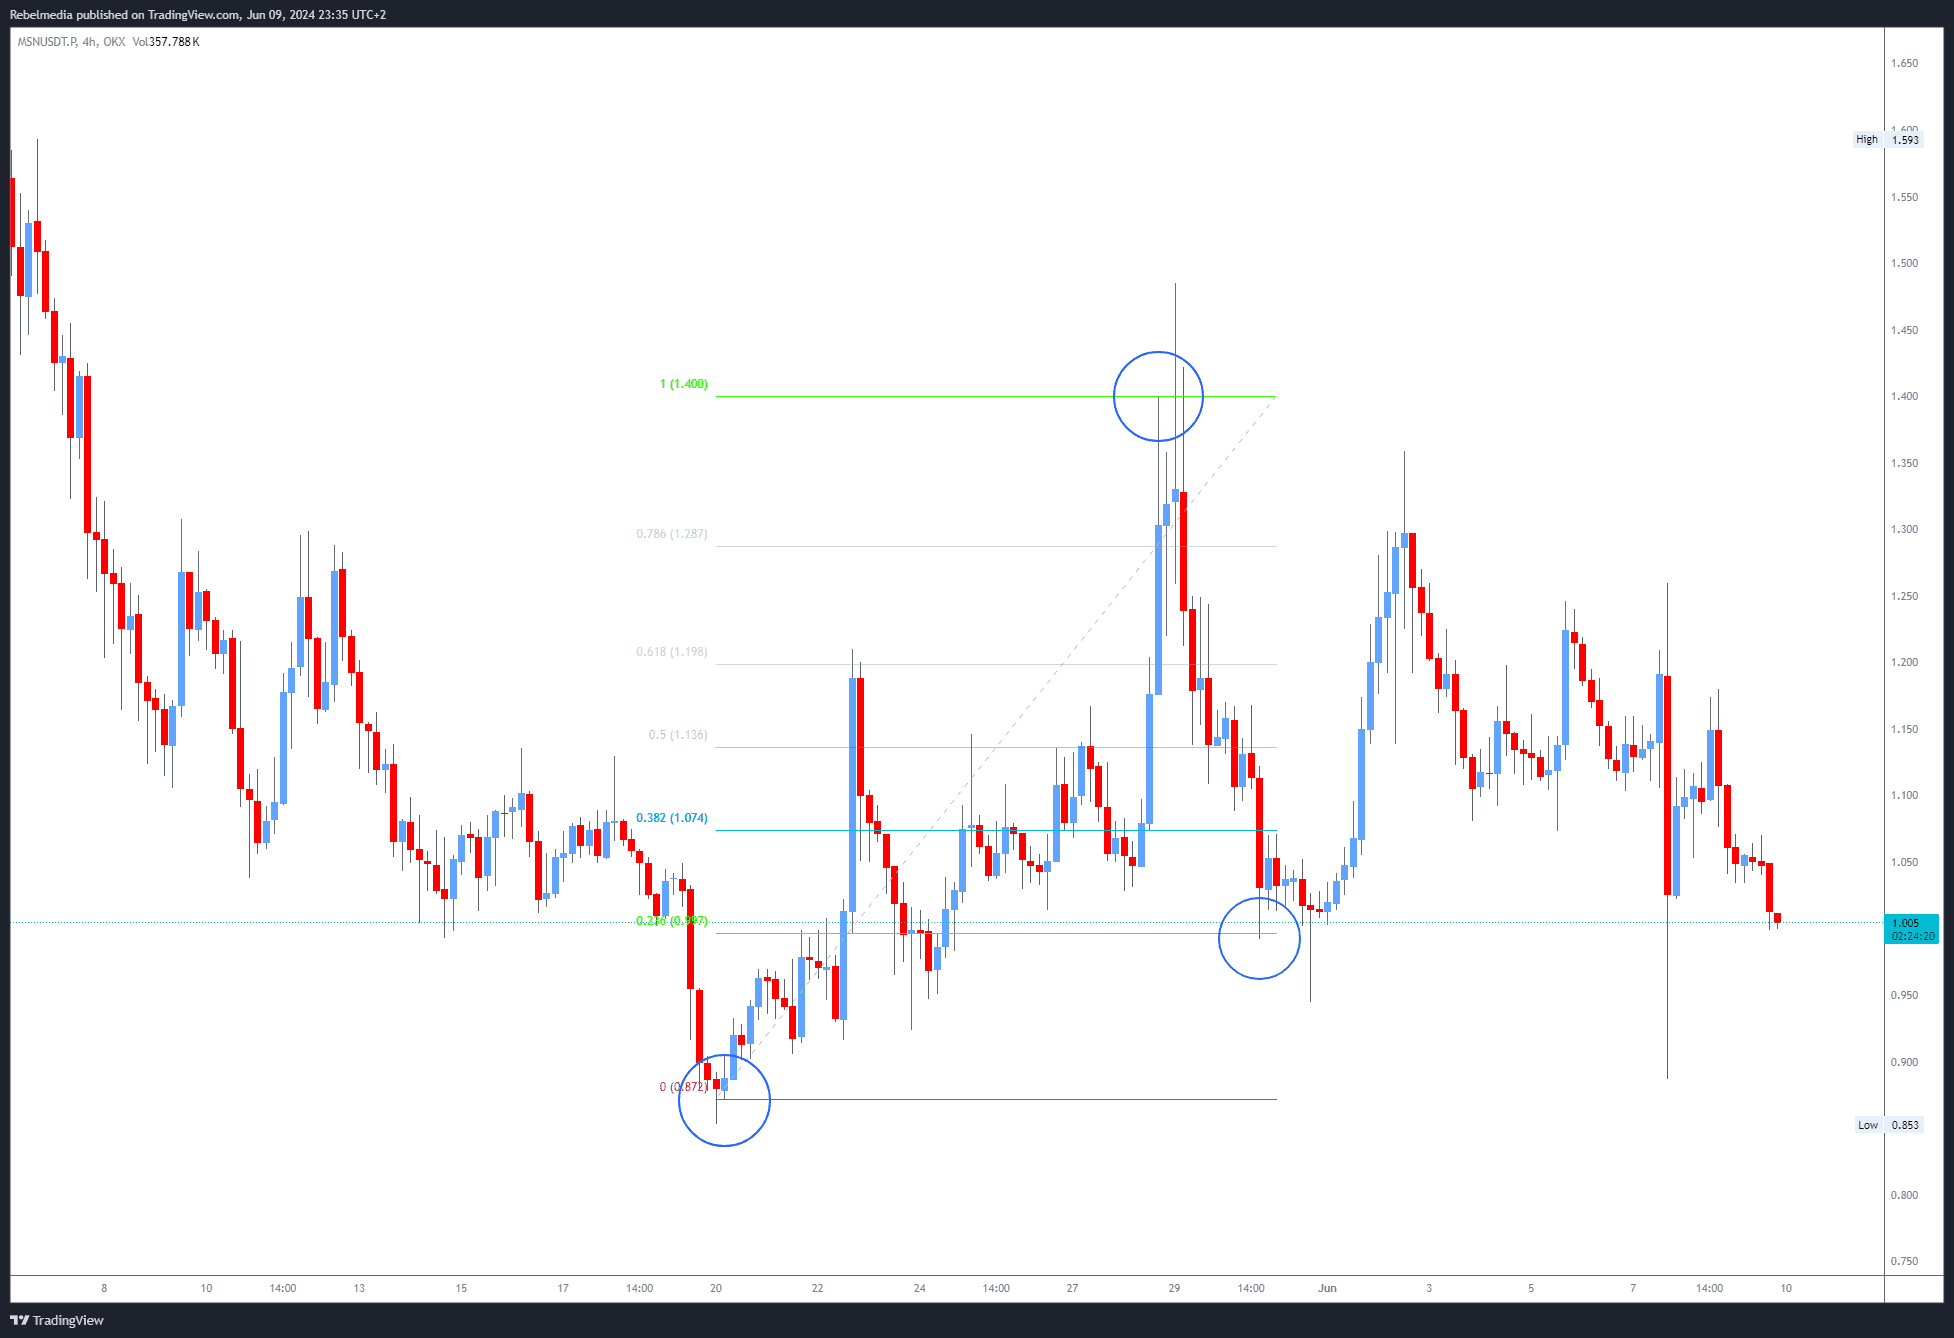
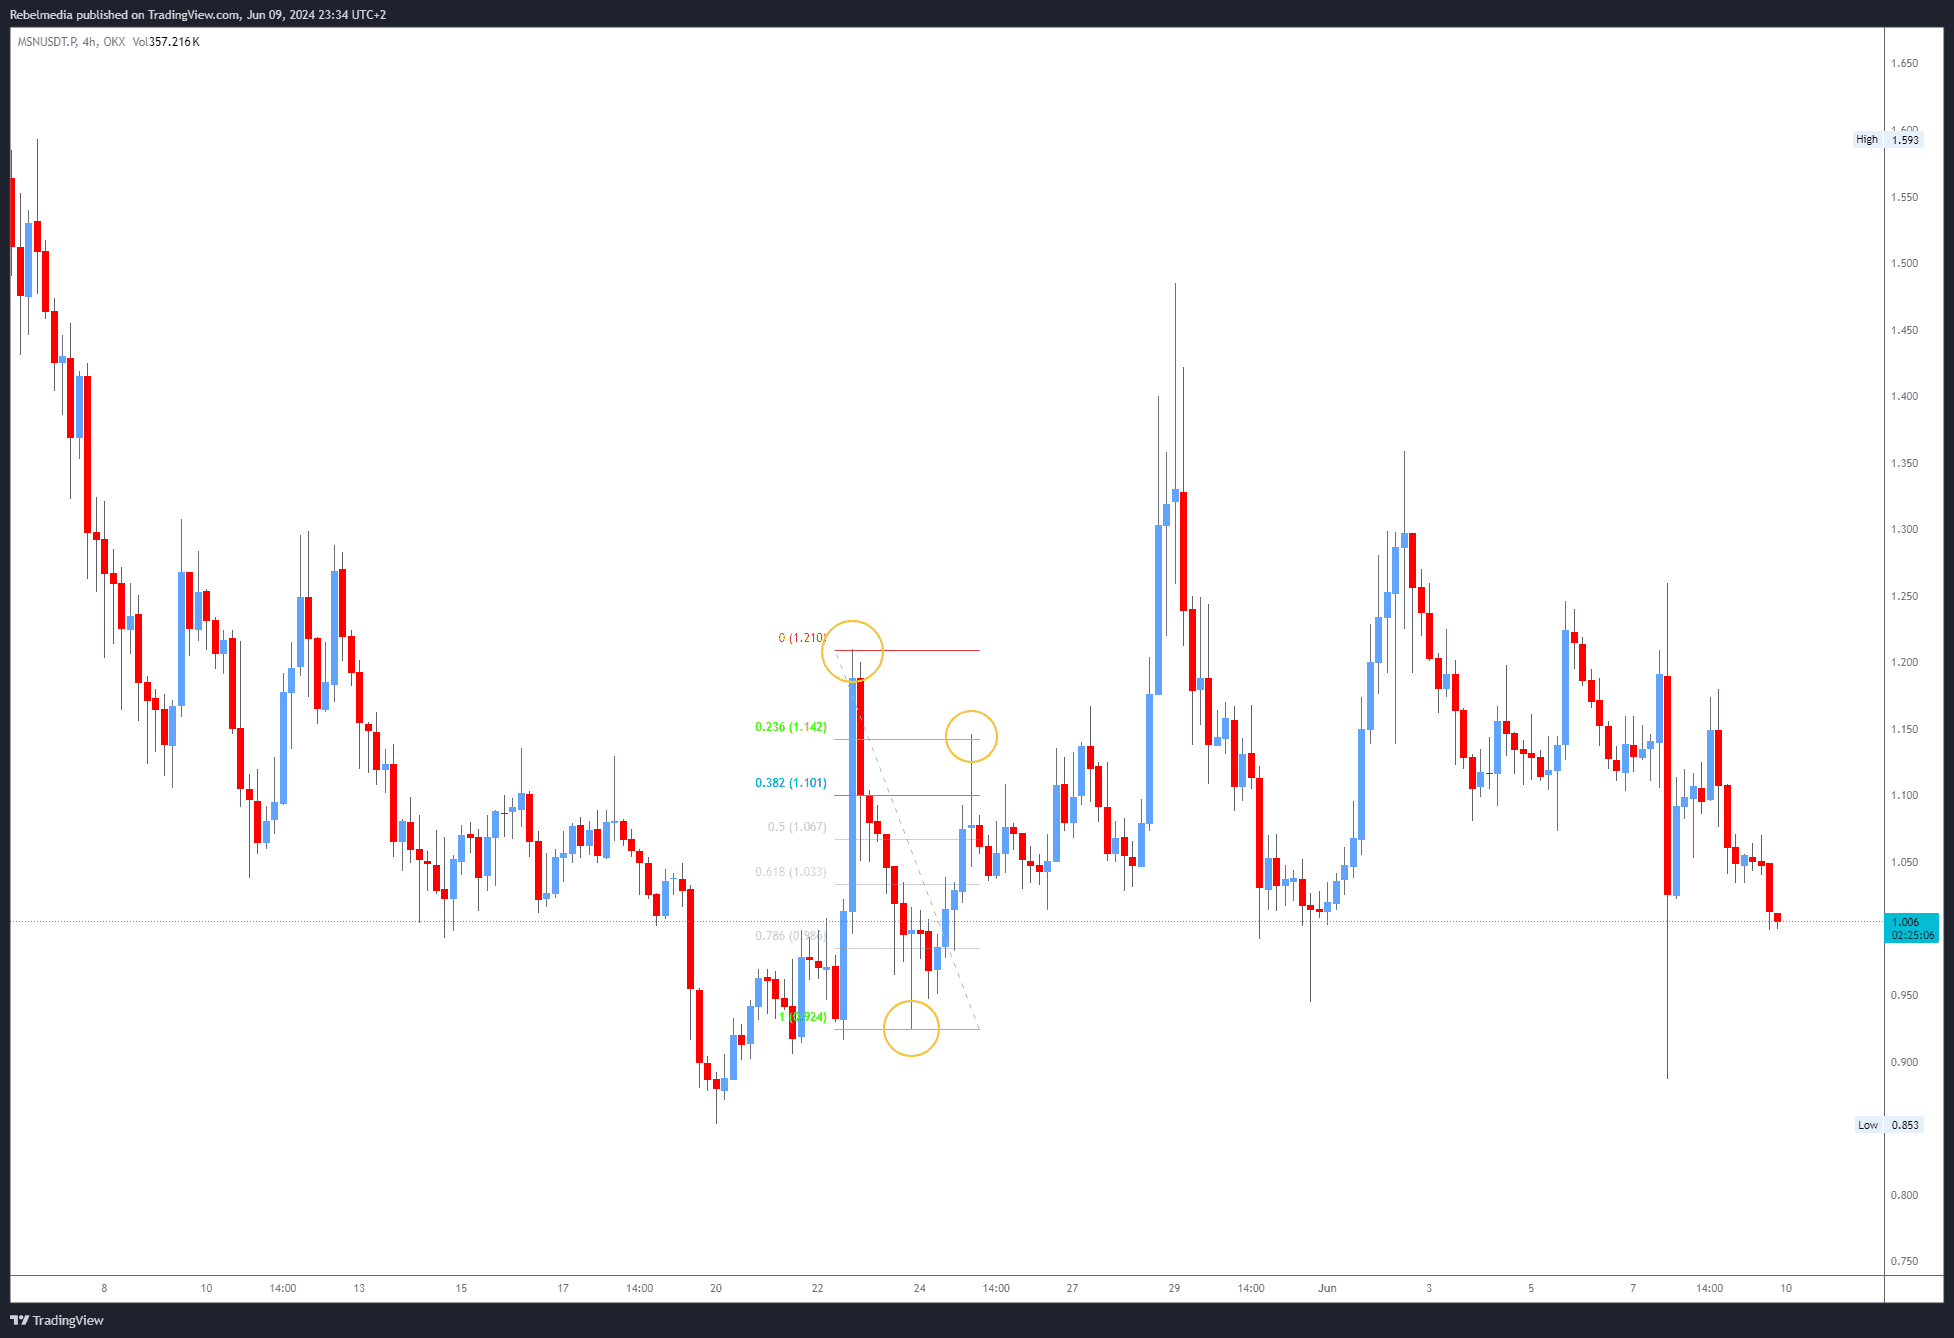
Click anywhere on the chart to skip to the next fractal in the sequence.
Note the level of perfect adherence to the fib levels.
Note the level of perfect adherence to the fib levels.